An agent can return 200 OK, produce a fluent answer, and still fail the job. It may use the wrong source, call the right tool with the wrong account, repeat a side effect, or take twelve expensive model steps to reach an answer a human rejects.
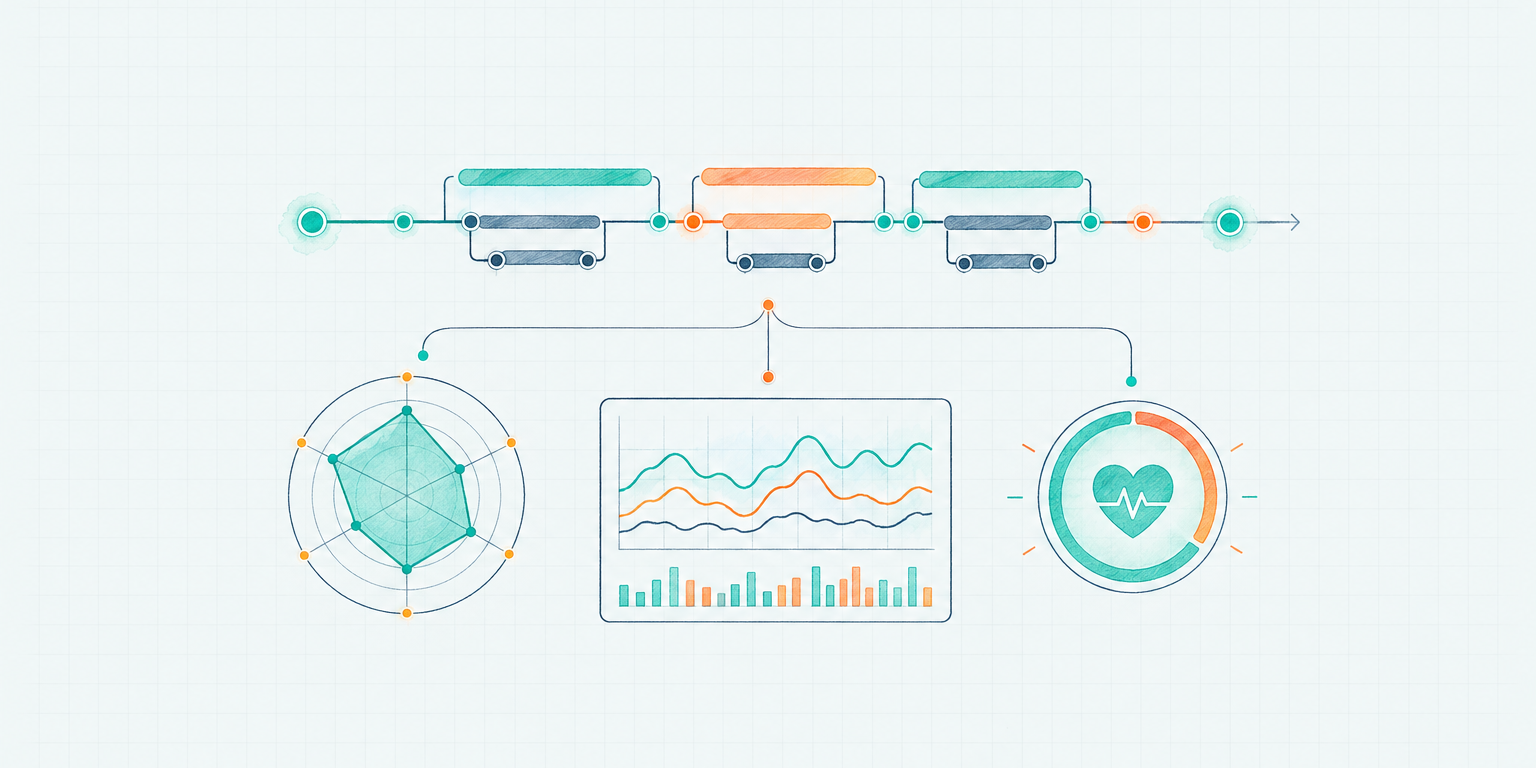
That is why AI agent observability needs a wider field of view than ordinary application monitoring. You need the execution trace, an evaluation of the result, and the business outcome tied to the same run. This guide shows how to build that operating loop and use it to catch failures before users become your monitoring system.
What AI agent observability means
AI agent observability is the ability to reconstruct how an agent moved from trigger to outcome, measure the quality of that path, and detect regressions across many runs.
A useful system answers four questions:
- What happened? The trigger, model calls, tool calls, errors, retries, and final output.
- Why did the run take that path? The instructions, context, tool schemas, and model configuration the agent received.
- Was the result good? Deterministic checks, model-based evaluations, and human review.
- Did the work matter? The external side effect and business outcome, such as a resolved ticket or an accepted draft.
Traditional telemetry remains necessary. Latency, error rate, and resource use can tell you that a service is healthy. They cannot tell you that an agent confidently updated the wrong customer record.
Traces, metrics, logs, and evals do different jobs
These signals overlap, but they are not interchangeable.
| Signal | Best question | Typical scope | Example |
|---|---|---|---|
| Trace | How did this run unfold? | One end-to-end execution | Trigger, model step, tool call, retry, response |
| Metric | Is a pattern changing? | Many runs over time | Completion rate, p95 latency, tokens per completed task |
| Log | What event occurred? | One timestamped event | Tool timeout, approval granted, context compacted |
| Evaluation | Was the behavior acceptable? | One output, step, or conversation | Correctness, policy compliance, source quality |
| Business outcome | Did the work create value? | Downstream system or workflow | Ticket stayed closed, message was accepted, record was correct |
A trace is the spine. Metrics summarize traces. Evaluations attach quality judgments to them. Business outcomes tell you whether those judgments predict anything useful.
Instrument the execution spine
Start with one correlation ID that follows the work from the incoming trigger to the final side effect. For a conversational agent, the session ID is a natural anchor. For a scheduled worker, use a run ID and carry it into every child task.
A production trace should preserve the following sequence.
1. Trigger and execution identity
Record why the agent started, which protocol or agent version ran, and who or what initiated it. Include the session or run ID, environment, and the business entity involved, using a safe identifier rather than raw personal data.
This is the difference between “the agent sent an email” and “protocol version 42 ran from the renewal reminder trigger for account 8192.”
2. Model requests and step statistics
Each model call should identify the provider, model, time, and usage. Token counts, cache reads, cache writes, output tokens, and reasoning tokens make cost and context growth visible at the step where they occur.
Full prompt capture is valuable during development because it shows the exact messages and tool definitions the model received. It is also sensitive and expensive. Use it deliberately, redact secrets, and give traced payloads a short retention period.
The OpenTelemetry Generative AI semantic conventions are pushing model, token, and finish-reason attributes toward a vendor-neutral vocabulary. That matters when one workflow uses several providers or sends telemetry into an existing OpenTelemetry pipeline.
3. Tool calls and results
Record the tool name, validated arguments, status, duration, and a safe representation of the result. Keep the relationship between the model step that requested a tool and the model step that consumed its output.
Tool observability should distinguish:
- the model chose the wrong tool
- the model supplied invalid arguments
- the tool failed before doing work
- the tool succeeded but returned bad data
- the tool completed a side effect that the agent later misreported
Those failures need different owners. Prompt tuning will not repair a flaky API, and an API retry will not repair a bad tool-selection policy.
4. Controls, retries, and context adaptations
Approval checks, policy decisions, retries, fallbacks, and context compaction belong in the trace. They often explain the run better than the final response does.
For example, an agent may look correct because a human rejected its first proposed action. That is a successful control and an agent-quality failure. If both become one generic “success” event, the team loses the lesson.
5. Final output and external outcome
Store the final response or artifact reference, then connect it to the effect in the system of record. A support answer can be well written while the ticket reopens. A lead-research agent can return valid JSON while identifying the wrong company.
The terminal state should be explicit: completed, escalated, cancelled, timed out, failed, or completed with correction. Avoid treating “the model stopped generating” as proof that the job finished.
Reading an Octavus execution trace
Octavus records a chronological execution log for each session. getLogs() returns triggers, messages, tool calls, model responses, model-request markers, per-step token statistics, errors, and other runtime events.
import { OctavusClient } from '@octavus/server-sdk';

const client = new OctavusClient({
  baseUrl: process.env.OCTAVUS_API_URL!,
  apiKey: process.env.OCTAVUS_API_KEY!,
});

const result = await client.agentSessions.getLogs(sessionId);

if (result.status === 'expired') {
  throw new Error(`Session ${result.sessionId} has expired`);
}

const eventCounts = result.entries.reduce<Record<string, number>>(
  (counts, entry) => {
    counts[entry.type] = (counts[entry.type] ?? 0) + 1;
    return counts;
  },
  {},
);

console.table(eventCounts);

if (result.truncated) {
  console.warn(`Showing the latest 3000 of ${result.total} entries`);
}
Always-on telemetry keeps production traces useful without storing every prompt. Each provider call produces a lightweight model-request marker, and each LLM step produces step-stats with its token breakdown. If a debugging session needs the exact provider payload, enable model request tracing:
const client = new OctavusClient({
  baseUrl: process.env.OCTAVUS_API_URL!,
  apiKey: process.env.OCTAVUS_API_KEY!,
  traceModelRequests: process.env.TRACE_MODEL_REQUESTS === 'true',
});
Model request tracing captures system prompts, messages, tool definitions, provider options, and generation parameters. Octavus enables it automatically for preview sessions and recommends leaving full payload tracing off by default in production. The lightweight markers and step statistics remain available.
This split is useful: trace the structure everywhere, then temporarily increase payload detail where you are investigating a reproducible problem.
Treat privacy as part of observability design
Agent traces can contain customer text, uploaded files, retrieved records, tool arguments, credentials, and internal instructions. Copying all of that into a second analytics system creates a new data store with a large security boundary.
Use four controls from the start:
- Minimize: collect the fields needed to debug and evaluate the workflow.
- Redact: strip credentials, tokens, personal data, and restricted fields before export.
- Restrict: separate access to operational metrics from access to full trace content.
- Expire: use shorter retention for full prompts and tool payloads than for aggregate metrics.
Sampling also needs intent. Random sampling is fine for baselines, but keep every failed, escalated, policy-blocked, high-cost, and user-corrected run. Those are the cases most likely to improve the system.
Turn traces into evaluations
A trace explains one run. An evaluation turns part of that run into a score that can be compared across versions.
Use three evaluator types.
Deterministic evaluators
These are code checks with clear pass or fail conditions. They are the best first layer because they are fast and repeatable.
Examples include:
- required tool was called exactly once
- no write tool ran before approval
- output matches the required schema
- citations use an approved domain
- the workflow stayed under a latency, token, or retry budget
- the external record contains the intended value
Deterministic checks are especially good for control flow and side effects. If a refund above $100 requires approval, do not ask another model whether the policy was “probably followed.” Inspect the approval and refund events.
Model-based evaluators
Use an LLM judge when the quality bar depends on meaning: factual support, instruction following, tone, completeness, or escalation quality.
Give the evaluator a narrow rubric and the evidence it needs. Ask for structured output with a score, reason, and cited trace fields. Calibrate it against human labels before using the score as a release gate.
Model-based evaluation has its own failure modes. The judge may prefer longer answers, share the same blind spot as the agent, or drift after a model update. Track evaluator versions just as carefully as agent versions.
Human review
People remain necessary for ambiguous cases, high-impact work, and calibration. Reviewers should label the failure mode, not only assign a thumbs-up or thumbs-down.
A compact taxonomy is enough to start:
- bad instruction or missing policy
- missing, stale, or poisoned context
- wrong model decision
- wrong tool or invalid arguments
- tool or provider failure
- approval or permission failure
- duplicate or incorrect side effect
- poor final communication
- correct execution, bad business result
The label tells you what to change. A single quality score does not.
Build the production-to-regression loop
The strongest evaluation datasets come from real work. Synthetic cases help with coverage, but production reveals the expired credentials, odd documents, ambiguous requests, and system behavior your launch checklist missed.
Use this loop:
- Capture failed, corrected, escalated, and unusually expensive traces.
- Classify the first point where the run diverged from the intended path.
- Reduce the trace to a reproducible case with sensitive data removed.
- Add the case to a versioned regression set.
- Change one layer such as the protocol, prompt, tool, model, or policy.
- Replay the regression set and compare quality, cost, and latency.
- Release only when the target failure improves without creating a worse regression elsewhere.
This loop turns observability into release control. It also gives incident reviews a productive ending: the failure becomes a test that future versions must pass.
Monitor the funnel, not a single success rate
A top-line completion rate hides where an agent is struggling. Build a funnel that reflects the workflow:
- trigger accepted
- required context loaded
- model reached the intended tool
- tool completed successfully
- control checks passed
- final artifact produced
- downstream outcome accepted
Track rates and latency between each stage. Then segment by agent version, model, trigger, tool, customer cohort, and task type.
Useful production measures include:
- Reliability - completion, escalation, correction, duplicate-action, and retry rates.
- Quality - deterministic pass rate, judge score distribution, human acceptance, and policy violations.
- Performance - end-to-end latency plus time spent in model, tool, queue, and approval steps.
- Cost - tokens, model calls, tool calls, and cost per accepted outcome.
- Context health - prompt size, compaction frequency, bounded tool outputs, and context-limit recovery.
- Outcome - resolved tickets, accepted drafts, correct records, recovered revenue, or another job-specific result.
Watch distributions rather than averages. A stable mean can hide a small group of very slow or very expensive runs. For latency and cost, p50, p95, and p99 tell a more useful story.
Alert on symptoms users should never discover first
Page a person only when fast action matters. Route slower quality drift into an investigation queue.
Good immediate alerts include:
- a write action occurred without the required approval event
- duplicate side effects crossed a threshold
- authentication or permission errors spiked
- provider or tool failures breached the workflow's error budget
- cost per run increased sharply after a release
- the same agent entered a retry loop
Quality trends such as falling citation support or rising human edits usually need a daily or weekly review, not a 3 a.m. page.
Octavus also exposes structured client errors with an error type, source, retryability, provider details, and optional retry timing. Keep rate limits, quota exhaustion, authentication failures, provider timeouts, and tool errors separate in dashboards. Their remediation paths are different.
Observe context management and recovery
Long-running agents fail in ways short chat demos rarely reveal. Tool output can overflow the model's context. Old messages can crowd out the original goal. Providers can reject too many images or an oversized image.
Octavus context management can bound large tool results, compact older history, and recover from token or image-limit failures. These adaptations are visible in the execution log through events such as tool-output-bounded and image-adapted. The full stored conversation remains intact while the model receives a bounded or compacted view.
Those events deserve metrics. A sudden rise in compaction may mean sessions are doing more work, but it may also mean prompts grew after a release. Frequent bounded tool outputs may point to a tool that should support pagination or narrower queries.
An AI agent observability checklist
Before an agent handles production work, confirm:
- Every run has a session or correlation ID.
- Trigger, agent version, model, tools, and terminal state are recorded.
- Model calls have timing and token statistics.
- Tool calls distinguish selection, validation, execution, and result failures.
- Approvals, retries, fallbacks, and context adaptations appear in the trace.
- Full payload tracing is restricted, redacted, and short-lived.
- Deterministic checks cover schemas, policy gates, and side effects.
- Model-based evaluators have a narrow rubric and human calibration.
- Failed and corrected production traces feed a regression set.
- Dashboards connect technical signals to accepted business outcomes.
- Alerts distinguish urgent incidents from slower quality drift.
- Every major failure type has a named owner and response path.
Building Production AI Agents covers the broader infrastructure around sessions, tools, streaming, and deployment. For the controls that determine what an agent may do, read the AI Agent Governance Playbook. If you want those operating rules to stay reviewable as code changes, see Declarative Agent Orchestration.
AI agent observability works when a team can move from “this result looks wrong” to the exact step, condition, and version that caused it. Once that path is visible, the failure can become a test instead of a recurring surprise.
Getting Started
Browse pre-built Octavus Agents to delegate a real workflow with visible execution, or read the developer documentation to build an agent with stateful sessions, structured errors, and chronological execution logs.
Build an agent whose runs can be traced, evaluated, and improved from the first production session.